


Economic Indexes and Charts
Ethos Coincident Economic Index, Ethos Leading Economic Index & Ethos Recession Probability
The analysis is based on the academic work which can be accessed here .
These indexes summarize the economic and financial conditions for the Turkish economy, utilizing a rich dataset that incorporates macroeconomic and financial indicators.
Financial stability can be perceived as a pre-condition for economic growth. Exploiting the interaction between the economic and financial indicator indices, recession probabilities for the Turkish economy in the near feature are computed.
Ethos Economic Policy Uncertainty Index
The analysis is based on the academic work which can be accessed here .
This figure plots weekly Ethos Economic Policy Uncertainty index from January 1, 2013 to September 30, 2022. This figure tracks the evolution of economic policy uncertainty for Turkey by capturing significant political, economic, and financial developments. Higher values of the index correspond to more uncertainty in economic policy.
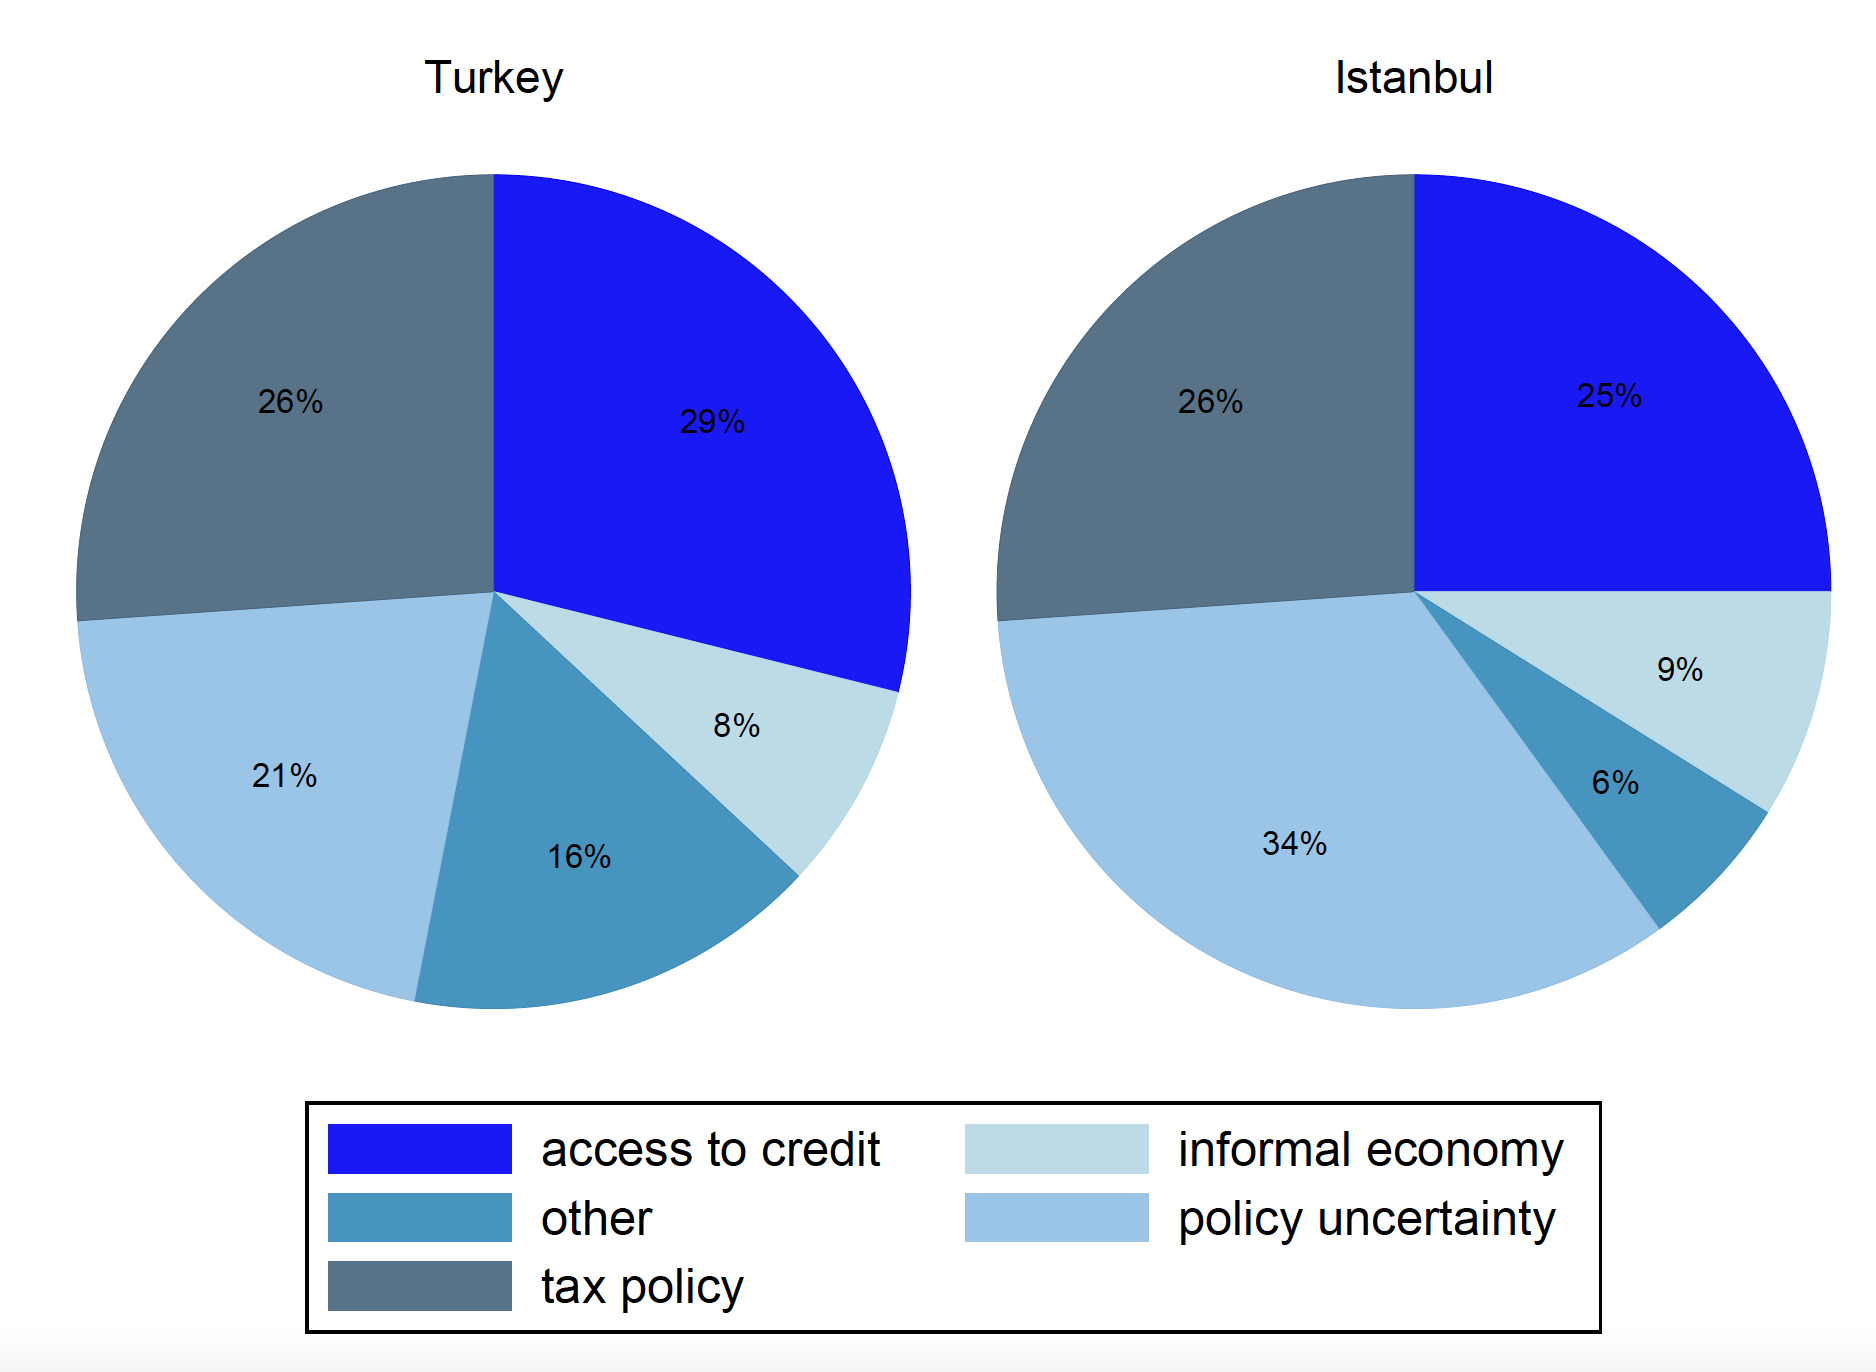
Factors Affecting the Operations of Turkish Firms
The analysis is based on the academic work which can be accessed here:
https://www.frontiersin.org/articles/10.3389/fphy.2022.864207/full
Firm-level Analysis
The analysis is based on our academic work which can be accessed here:
The survey data that is used in this analysis can be accessed here .

This map shows the economic costs of inequitable distribution of vaccines. The economic costs reflect supply chain distortions. Darker shades illustrate higher economic costs. This analysis is based on the academic work which can be accessed here.
New York Times Haberi
The Economic Costs of Vaccine Nationalism
The analysis based on the academic work can be accessed here .
Each color in the given pie chart shows the relative weight of the corresponding factor in the firms’ operations. Source: WB-EBRD, May 2019.
Forecasting key macroeconomic variables including growth, inflation rate, interest rate, yield curve, exchange rate, current account deficit at high frequencies
Predicting and interpreting these forecasts allow the decision makers to develop a well-grounded opinion about the economic outlook.

Analyzing interest rate decisions by the Central Bank of the Republic of Turkey as well as major central banks abroad
Our hands-on experience in central banking allows us to watch, interpret and predict central banks’ decisions accurately and analyze their implications on the Turkish economy.

Analyzing the effects of supply chain disruptions on global trade networks
We can apply our methodological framework to calculate the economic impact of external events (such as the pandemic, the war in Russia, or any other supply chain disruptions) on global trade relations.

Analyzing industry and firm dynamics
Using our expertise with internationally harmonized firm- and bank-level balance sheet/income statement databases including Orbis, Amadeus, Compustat and Bankscope, we provide detailed investigations of how firm/bank outcomes translate into the aggregate industry and economy-wide performance.

The effects of macroeconomic developments on sectors and firms
We quantify the impact of macroeconomic variables such as interest rate decisions, macroprudential policies, inflation rate, uncertainty or the exchange rate on firms’ real/financial activities and bank dynamics.

Our work on the economic costs of vaccine inequality was introduced to the media by the General Secretary of World Health Organization, Dr. Tedros.
Presentation of Our Work
Appearance of Our Work on International Media Outlets
Each color in the given pie chart shows the relative weight of the corresponding factor in the firms’ investment decisions on green economy (May 2019). This analysis is based on the academic work which can be accessed here.
Each color in the given pie chart shows the relative weight of the corresponding factor in the firms’ operations (May 2019). This analysis is based on the academic work which can be accessed here.


b) İstanbul

a) Türkiye
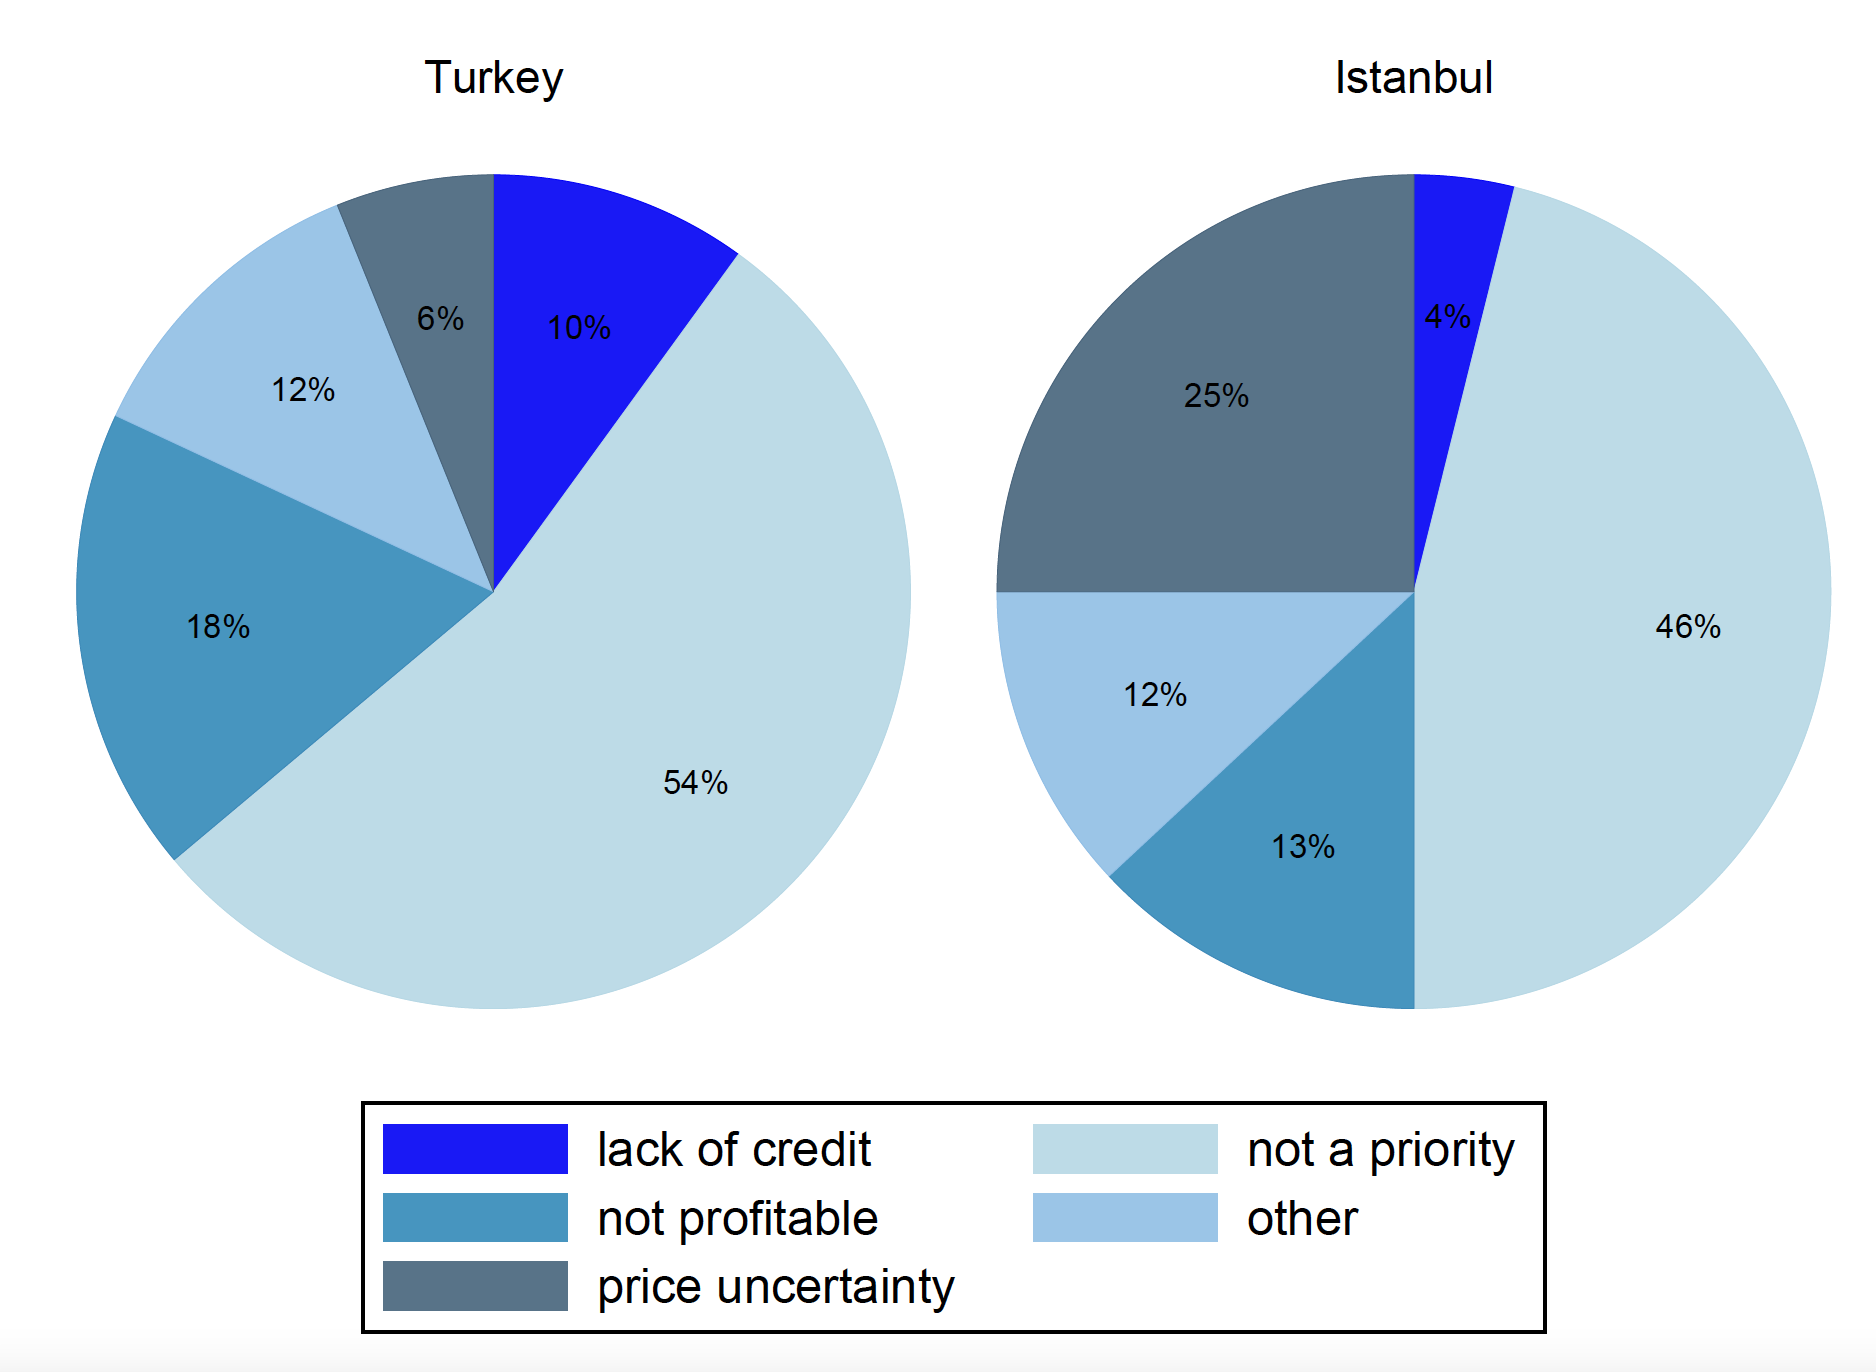
Factors Limiting Turkish Firms’ Investment on Green Economy
Factors Restraining Turkish Firms
Each color in the given pie chart shows the relative weight of the corresponding factor in the firms’ operations (May 2019). This analysis is based on the academic work which can be accessed here.
